
Interpreting Data Visually: An In-Depth Look at Area Charts
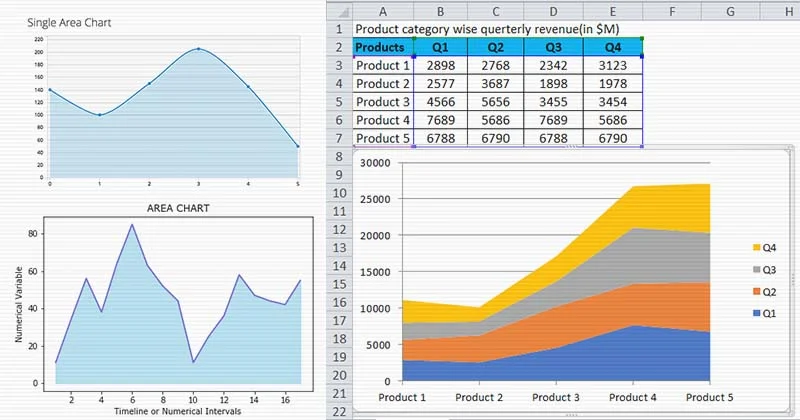
When it comes to data visualization, nothing beats the power and clarity of an area chart. Area charts represent quantitative data over time and show a compelling image of trended data, clearly highlighting changes over time. This article will cover more about the area chart. Keep reading to learn the area chart definition and other […]
Interpreting Data Visually: An In-Depth Look at Area Charts Read More »