Intro:
Engineering teams use a plethora of different tools and methodologies to accomplish work and deliver projects. And project management actually stands up as the ‘backbone’ of successful project delivery.
Here’s the issue with engineering projects—they tend to come with a lot of complexity. They tend to need to go through several iterations and stages before reaching a state of ‘completion.’ But what stages do they need to go through? And what steps can be taken to help ensure project success at the project management level?
When it comes to finding a visually intuitive and efficient means of planning, tracking, and coordinating projects, GANTT charts have really stood out as being one of the ‘go to’ methods that actually work.
And in this article, we’re going to talk about not only what they are, but why they matter. Let’s dive into it.
What Are GANTT Charts?
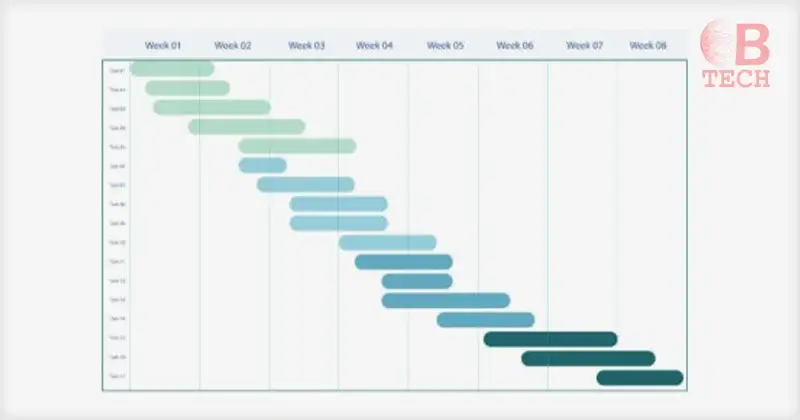
GANTT charts (which are named for the man who designed them back in the 1910s, a man by the name of Henry Gantt) are basically a type of bar chart that illustrates a project schedule.
They’re very popular with engineering projects, but actually, they’re used for all kinds of different things—and they tend to show up anywhere where ‘team project management’ is an issue.
What Makes GANTT Charts Useful?
GANTT charts are useful in project management toolsets because they help to illustrate a clear overview of the project deadline and status.
Since engineering projects often involve multiple phases, and also tend to need built-in tasks and dependencies, GANTT charts work particularly well because they help to display these types of things in a cohesive visual format that makes them easier to grasp.
GANTT charts help teams to identify critical milestones, understand the flow of projects, and even find/identify potential bottlenecks that could crop up once the project gets going.
And thanks to the visual nature of this specific type of chart, it goes without saying that it really makes the ‘potentially problematic’ elements of engineering projects easier to spot.
GANTT Charts Help To Improve Resource Allocation
In engineering projects, resource allocation is critical. Engineering teams often need to juggle limited resources across a multitude of different projects. This is especially true of larger companies that may have limited resources, but be engaged in different projects spanning a wide geographic range.
GANTT charts help engineering companies to control resource allocation, as this is a crucial pillar of successful project management—especially when it comes to engineering.
GANTT Charts Help To Drive Project Success
At the end of the day, project success relies on information. And for project managers, especially in the engineering sector, finding reliable project information has always been a major challenge.
Why?
Because the quality of information has always been filtered by the means of delivery. And honestly, when it comes to project management, a lot of stuff has always been delivered in either written word format or singular dimension visuals.
The GANTT chart helps to rectify this by making the project visible across a spectrum of time, and also by taking into account many different data points.
The number of data points your specific chart takes into account will vary with the project, but in most GANTT charts you’re looking at a range of data points to help you manage project progress all the way to completion.
Some of these data points include task names, start dates and end dates, duration, dependencies, milestones, assignees, progress, resource allocation, and even a critical path, which is the sequence of dependent tasks that determines the minimum project duration over time.
In fact, even smaller charts may include a few dozen data points representing a number of tasks and dependencies, while larger and more complex engineering projects can sometimes involve hundreds or even thousands of different data points, mostly consisting of tasks and dependencies.
All of that data helps the engineering team to understand the project, the scope of the potential difficulty, and the proper allocation of resources, not just in money but also in time and materials that will be required to complete it successfully.
Conclusion
It’s the end of the day, the GANTT chart is massively valuable for engineering teams.
This is true not just for engineering, but for all kinds of different types of project management.
If you aren’t yet using it in your organization, now may be the time to start.