
What Is Year-Over-Year (YOY)?
Year-over-year (YOY) is also known as year-on-year, is a common method for comparing financial data annually. It helps determine whether a company’s financial health is getting better, staying the same or declining. For instance, financial statements might show that a company’s revenue has risen in the third quarter compared to the same quarter in previous years, for three consecutive years.
Key Points
- Year-over-year (YOY) Comparisons: This method allows for the assessment of various metrics by comparing data from one period with the same period the previous year, providing an annual perspective.
- Usefulness & Popularity: YOY comparisons are widely used and effective for analyzing a company’s financial health.
- Investor Application: Investors commonly rely on YOY reports to evaluate the financial progress of a company over time.
Understanding Year-Over-Year Growth
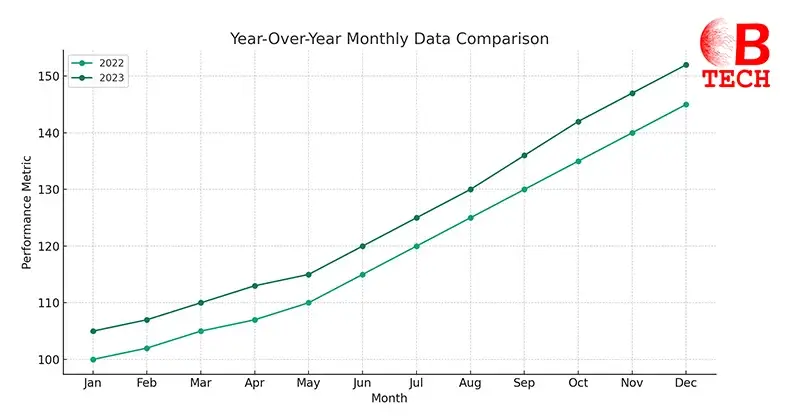
Year-over-year (YOY) growth is a method that measures a company’s performance by comparing its financial metrics from a recent month to the same month in the previous year. This method is generally seen as more informative than month-to-month comparisons, which can be skewed by seasonal variations.
Common YOY Comparisons
YOY evaluations can look at data annually, quarterly or even monthly to gauge performance.
Benefits of YOY
Using YOY data, analysts and investors can easily compare several years of first-quarter revenues, for example, to determine whether a company’s revenue is trending upwards or downwards. Consider Coca-Cola’s first quarter in 2021, which saw a 5% increase in net revenues compared to the first quarter of 2020. Such comparisons are valuable because they allow for clear insights despite seasonal shifts in consumer behavior, proving particularly useful in investment analysis as well.

- Clear Comparison of Growth: YOY provides a straightforward comparison of growth or decline over a full year, making it easier to discern long-term trends.
- Adjusts for Seasonality: YOY analysis effectively eliminates seasonal fluctuations by comparing the same periods across different years, offering a more accurate reflection of true performance.
- Useful for Long-Term Planning: Companies and investors find YOY data valuable for strategic planning as it shows performance stability or change over an extended period.
- Widely Accepted Method: YOY is a standard, familiar and trusted method in financial analysis, widely used across industries for financial reporting and assessment.
- Enhances Yearly Comparisons: It simplifies the evaluation of a company’s or market’s year-to-year performance, aiding in clearer decision-making processes.
If you are thinking of investing in something than you must go through How2Invest. It is a platform of financial education that holds the key to unlocking the world of opportunities.
Why Use YOY?
YOY analysis is popular because it effectively accounts for seasonality, which can significantly affect business performance. For instance, retail sees a surge in the fourth quarter due to the holiday season.
Comparing a fourth quarter of one year with that of another offers a clear view of growth or decline, sidestepping misleading seasonal effects. Similarly, comparing quarter-on-quarter could give the false impression of dramatic changes due to these seasonal spikes or drops.
Difference from Sequential Comparisons
Unlike sequential comparisons, which look at growth from one month or quarter to the next, YOY comparisons provide a broader perspective by linking similar seasonal periods across years. For example, comparing the number of cell phones sold or airline seats filled from one quarter to the next might show linear growth but doesn’t account for seasonal trends.
Real-World Example
In its 2018 fourth-quarter report, Kellogg Company showed a decline in YOY earnings despite a rise in sales from corporate acquisitions. The report predicted a further 5% to 7% drop in adjusted earnings for 2019 as the company expanded into new channels and packaging formats. Despite this, Kellogg’s substantial market presence and adaptability to consumer trends kept its long-term outlook positive. The company also planned a reorganization in its North America and Asia-Pacific segments to streamline operations and enhance focus on emerging markets in Asia, the Middle East and Africa.
FAQs
What does YOY measure?
YOY or year-over-year, is a tool used to compare statistics from one period to the same period one year earlier. It’s ideal for seeing how a company’s revenue or profits have grown over a year and is also used to track changes in economic indicators like GDP or money supply.
How do you calculate YOY?
To calculate YOY growth, divide this year’s value by last year’s value, then subtract one. The result is usually expressed as a percentage, giving a clear picture of growth or decline over the past year.
What is the difference between YOY & YTD?
While YOY measures changes over a full year, YTD (year-to-date) tracks changes from the beginning of the current calendar year up to the present. YOY offers a comparison over 12 months, whereas YTD provides a snapshot of performance from January 1st to the current date.
What if I need to compare shorter periods?
For shorter time spans, you can use month-over-month or quarter-over-quarter comparisons. These methods work similarly to YOY but focus on a monthly or quarterly basis, allowing for more immediate insights into trends and changes.
The Bottom Line
Year-over-year (YOY) analysis is an invaluable tool in finance for assessing changes over time, adjusting for seasonal variations and providing a clear view of a company’s growth trajectory. Whether analyzing quarterly revenues, evaluating the impact of strategic decisions, or tracking economic indicators, YOY offers a comprehensive and nuanced perspective. By comparing similar periods across different years, analysts and investors can gain deep insights and make informed decisions, ensuring a thorough understanding of financial trends and business cycles.