

CPU sizing in Kubernetes looks simple until performance, stability, and cost start pulling in different directions. CPU requests and CPU limits control two different parts of the system, and small mistakes can trigger throttling, slow rollouts, noisy neighbor issues, or wasted capacity. This guide breaks down what each setting does, how Kubernetes enforces it, and how to choose values that match how your workloads really behave.
Kubernetes manages applications running in containers, making container architecture an important foundation for understanding CPU resource allocation. Readers who are new to this technology can explore our containers vs virtual machines comparison to understand how containers share operating system resources and how their architecture differs from traditional virtual machines.
Kubernetes CPU Requests
A CPU request defines how much CPU a workload needs for Kubernetes scheduling. The kube-scheduler compares a Pod’s effective CPU request with the allocatable CPU capacity of available nodes before selecting a placement. CPU requests influence how workloads are distributed across a cluster, but they do not permanently dedicate physical CPU cores to individual containers. At runtime, requests also influence how CPU time is shared when multiple workloads compete for processor capacity.
CPU requests do not guarantee constant CPU at runtime. They set the baseline share used by the Linux scheduler through cgroups, which matters most when the node is under CPU contention. When CPU is plentiful, containers can often use more than their request if no limit blocks them.
Kubernetes measures CPU in cores and millicores. For example, 1000m represents one CPU, while 250m represents one-quarter of a CPU. The official Kubernetes resource management guide explains how CPU requests influence scheduling, how resource values are measured, and how the Linux kernel enforces CPU limits.
Kubernetes CPU Limits
A CPU limit is a hard ceiling for how much CPU a container may use. When a container hits its limit, the kernel throttles it rather than killing it. Throttling can look like random latency spikes, stalled background jobs, or unexpectedly long request times under load.
CPU limits are enforced over repeated quota periods, so short bursts can be clipped even when the node has spare CPU. This is why CPU limits can reduce tail latency predictability for certain apps, especially those with bursty traffic patterns or garbage collection pauses.
Example: Setting a CPU Request Without a CPU Limit
Kubernetes resource settings are usually defined inside a container’s configuration in a Pod or Deployment manifest. The following example assigns a CPU request while leaving the CPU limit unset.
resources:
  requests:
    cpu: "250m"
    memory: "256Mi"
  limits:
    memory: "512Mi"
In this example, the container requests 250 millicores, equivalent to one-quarter of a CPU core. Kubernetes uses that value when scheduling the Pod. Because no container-level CPU limit is configured, the application can use additional CPU when capacity is available, subject to node contention and other applicable controls.
The example also sets a memory limit, which is managed differently from CPU limits. Teams should test resource values against actual workload behavior and check whether namespace policies apply additional defaults.
What Happens When Requests are Too Low?
Requests that are set too low make the scheduler think your workload is cheaper than it is. Pods may pack tightly onto nodes, which increases the chance of contention when multiple services get busy at the same time. The result is a cluster that looks efficient on paper but behaves unpredictably in production.
Low CPU requests also reduce a container’s relative CPU share when workloads compete for processor time. This can increase response times even when no CPU limit is configured. Requests also influence CPU-based Horizontal Pod Autoscaling (HPA), which measures CPU utilization as a percentage of requested CPU. An unusually low request can make utilization appear higher and trigger earlier scaling, while a very high request can delay scaling. Because new Pods take time to start, autoscaling cannot always prevent short-term performance problems.
- Scheduling Pressure: Pods land on nodes that cannot sustain their real CPU needs during peaks.
- Latency Under Contention: The workload receives a smaller relative share of CPU time and experiences higher response times.
- Misleading HPA Utilization: Incorrect CPU requests distort utilization percentages, potentially causing premature scaling, delayed scaling, or inefficient replica counts.
Once requests are realistic, other tuning like autoscaling and node sizing becomes far more reliable.
CPU-based autoscaling depends on correctly configured CPU requests. For example, a container using 200m of CPU reports 80% utilization against a 250m request but only 20% against a 1000m request. The Kubernetes Horizontal Pod Autoscaling documentation explains how the autoscaler calculates CPU utilization and why missing CPU requests can prevent scaling based on that metric.
What Happens When Requests are Too High?
Requests that are set too high block scheduling even when actual usage is modest. You get Pending Pods, slower deployments, and expensive overprovisioning, especially in clusters with strict node pools. Inflated requests are an important cause of low node utilization.
High CPU requests can reduce scheduling flexibility for applications with changing workloads. Kubernetes counts requested CPU against a node’s allocatable capacity, even when actual CPU usage is much lower. This can prevent additional Pods from being scheduled on that node, although running containers can still use otherwise available CPU. Over time, teams may add unnecessary nodes to accommodate inflated requests, increasing infrastructure costs without delivering meaningful performance improvements.
- Pending Pods: Rollouts stall because the scheduler cannot find nodes with enough unallocated CPU request capacity.
- Reduced Density: Nodes run far below capacity because inflated requests prevent additional Pods from being scheduled.
- Higher Cloud Bills: Extra nodes are added to satisfy resource requests rather than actual demand.
Right-sizing requests often produces immediate cost savings while keeping reliability intact.
CPU overprovisioning is also an important cloud cost management issue. Organizations can reduce unnecessary infrastructure spending by comparing allocated resources with actual application requirements. Our FinOps guide to controlling cloud costs explains how teams can identify wasted capacity, track resource spending, and make more informed infrastructure decisions.
What Happens When Limits are Too Low?
Limits that are set too low cause CPU throttling even when the node has idle CPU. This is counterintuitive for many teams because the container appears healthy and the node shows available capacity. The application still slows down because the kernel enforces the cap.
Throttling is especially painful for latency-sensitive services. It can also affect batch jobs by stretching their completion time, which then increases queue depth and creates secondary load elsewhere in the system.
- Higher P99 Latency: Request handling slows when the container is capped during bursts.
- Longer Job Runtimes: Batch and ETL tasks take longer, delaying downstream workloads.
- Misleading Capacity Signals: Node metrics show headroom while the container remains throttled.
When limits are needed, they should reflect realistic peak usage rather than average utilization.
Severe CPU throttling can also delay application health-check responses, complicating deployments and incident investigations. If a container cannot respond to health checks within the configured time, Kubernetes may treat it as unready or unhealthy depending on the probe type. Our Kubernetes liveness vs readiness probes guide explains how these checks affect traffic routing, container restarts, and rollout stability.
What Happens When Limits are Too High or Missing?
High CPU limits or missing limits allow containers to use more CPU during traffic spikes, intensive processing, or unexpected application behavior. This can improve burst performance when spare capacity is available. However, when several applications demand CPU simultaneously, they must compete for processor time. Poorly configured requests can increase noisy-neighbor effects and make application latency less predictable. The risk depends on workload behavior, CPU requests, node capacity, and the cluster’s resource-management policies.
No limits can be acceptable for many services when requests are well tuned and the cluster has capacity, but this requires disciplined monitoring. Without visibility into per-container saturation, noisy-neighbor problems are harder to diagnose.
- Noisy Neighbor Risk: A busy Pod can reduce CPU availability for other workloads during spikes or application failure loops.
- Increased CPU Contention: Missing or undersized CPU requests can reduce a workload’s relative CPU share when several containers become busy simultaneously.
- Harder Incident Triage: CPU contention can appear as intermittent timeouts and unpredictable response times across multiple services.
If you choose to omit limits, treat it as an engineering decision backed by metrics and alerting.
CPU Throttling and How It Shows Up?
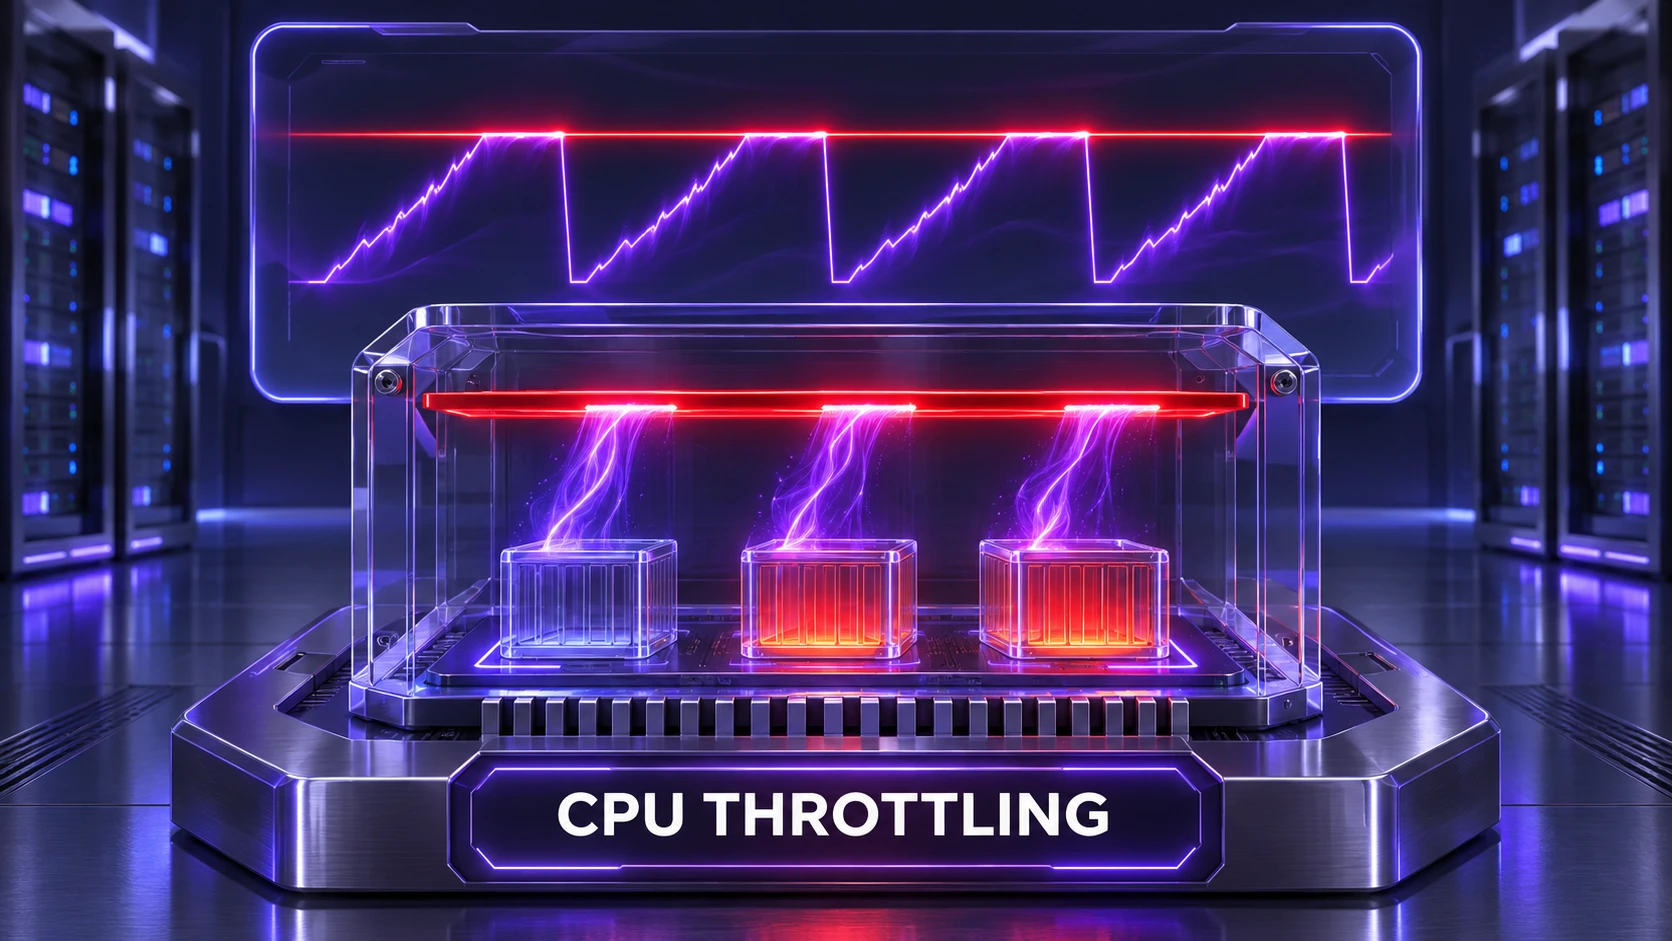
CPU limits translate to a quota in cgroups. When the container uses its quota for the current period, its execution can be throttled until the next period begins. This creates a sawtooth pattern where work proceeds in bursts, then stalls briefly, which can amplify tail latency.
Throttling often looks like application slowness without obvious errors. Node-level CPU can look fine, but container-level metrics reveal time spent throttled. Watching throttling counters alongside request latency and queue depth is more actionable than CPU percentage alone.
Teams using compatible Prometheus monitoring setups can inspect metrics such as container_cpu_cfs_throttled_periods_total, container_cpu_cfs_periods_total, and container_cpu_cfs_throttled_seconds_total. These counters help identify how frequently CPU throttling occurs and how much throttled time accumulates. The cAdvisor Prometheus metrics reference describes these measurements. Their availability can vary depending on the container runtime and monitoring configuration.
Kubernetes QoS Classes and Why They Matter?
Kubernetes assigns Pods one of three Quality of Service (QoS) classes: Guaranteed, Burstable, or BestEffort. For standard container-level configuration, Guaranteed QoS requires every container to have positive CPU and memory requests, with each request equal to its corresponding limit. Burstable QoS applies when a Pod has at least one CPU or memory request or limit but does not meet the Guaranteed requirements. BestEffort applies when no CPU or memory requests or limits are configured. Kubernetes versions supporting Pod-level resources also have rules for assigning QoS based on those settings.
QoS classes help describe how workloads are treated during resource pressure, particularly when nodes experience memory or storage shortages. However, eviction decisions also consider Pod priority and resource usage relative to requests. CPU contention alone does not normally cause Kubernetes to evict Pods because CPU usage can be throttled or shared.
For reliable workload management, teams should configure CPU and memory resources together, monitor actual consumption, and understand how requests influence both scheduling and runtime behavior.
The Kubernetes QoS classes documentation provides the official criteria for Guaranteed, Burstable, and BestEffort Pods. It also explains how resource configurations influence workload treatment when nodes experience resource pressure.
Right-Sizing CPU Requests and Limits
Good CPU sizing starts with measurement and a clear intent. Requests should reflect what the workload needs to run reliably during typical contention. Limits should exist when you need strict isolation or want to cap burst behavior for multi-tenant safety.
- Measure Real Usage: Use container-level metrics to capture steady-state usage, burst peaks, and throttling indicators.
- Set Requests to a Defensible Baseline: Pick a value the application can operate on during busy periods without relying entirely on spare CPU capacity.
- Decide Whether Limits Add Value: If throttling harms latency, consider removing CPU limits and relying on appropriately sized requests, capacity planning, and scaling.
- Validate With Load Tests and Rollouts: Watch startup time, error rates, and latency during deployments and traffic changes.
- Review Regularly: Revisit settings when code paths, traffic patterns, or dependencies change.
This approach reduces both overprovisioning and performance regressions caused by accidental throttling.
Resource optimization should also support measurable application reliability goals. Site Reliability Engineering (SRE) practices help teams connect performance metrics, service-level objectives, and operational decisions. Our SRE vs DevOps explainer discusses how reliability practices fit into modern infrastructure and software delivery.
Quick Reference Table for Common Outcomes
| Setting Choice | Typical Symptom | Most Likely Fix |
|---|---|---|
| CPU request too low | Latency spikes during node contention | Increase the request based on observed busy-period CPU usage. |
| CPU request too high | Pending Pods and underutilized nodes | Lower the request based on measured demand and use appropriate scaling for peaks. |
| CPU limit too low | CPU throttling despite idle node capacity | Raise the CPU limit or consider removing it for latency-sensitive services. |
| No CPU limit with poorly configured requests | Noisy-neighbor effects and unpredictable latency during spikes | Correct CPU requests first, then reassess whether strict CPU limits are necessary. |
Operational Checks That Prevent Misconfiguration
CPU sizing fails quietly until the system is stressed. A few routine checks catch problems early and keep clusters stable. Teams that operationalize these checks spend less time debating limits during incidents.
CPU requests and limits should also be maintained through controlled configuration changes. Teams using version-controlled Kubernetes manifests can review resource adjustments, test them before deployment, and reduce configuration drift between environments. Our GitOps vs CI/CD comparison explains how declarative configurations and automated delivery workflows support reliable infrastructure management.
- Track Throttling Metrics: Alert when throttled time rises alongside latency, even if node CPU usage looks healthy.
- Watch Pending Pods: Persistent Pending status during rollouts can indicate inflated CPU requests, insufficient node pool capacity, or other scheduling constraints.
- Review Autoscaler Signals: Compare HPA utilization targets with actual workload demand, CPU contention, and application performance rather than relying on CPU percentage alone.
- Standardize Requests and Review Limits: Use Kubernetes namespace policies and deployment reviews to establish appropriate CPU request defaults. Check automatically applied CPU limits carefully because restrictive defaults can cause unexpected throttling in production.
Kubernetes administrators can use LimitRange policies to define default resource requests, default limits, and allowed resource ranges within namespaces. The Kubernetes LimitRange documentation explains how these settings are applied and why teams should review namespace policies before assuming that a container has no CPU limit.
A consistent resource-management process helps teams make better CPU sizing decisions across development, testing, and production environments. Documenting resource settings, monitoring workload behavior, and reviewing configuration changes regularly can improve cluster reliability while keeping infrastructure costs under control.
Conclusion
CPU requests decide where your Pods land and how they compete under contention. CPU limits decide whether your containers can burst or get throttled even when capacity exists. When requests are wrong, scheduling and cost suffer, and when limits are wrong, performance becomes inconsistent.
Use measurements to set realistic requests, apply limits when they solve a specific risk, and monitor throttling as a first-class signal. With consistent sizing and operational checks, Kubernetes becomes more predictable, cheaper to run, and easier to scale.
Frequently Asked Questions
Should You Set CPU Limits for Every Kubernetes Container?
No, not always. CPU limits can protect multi-tenant clusters, but they can also cause throttling that hurts latency and throughput. Many teams set requests for scheduling and omit CPU limits for services where burst performance matters, relying on autoscaling, capacity planning, and good monitoring.
Why are My Pods Slow When Node CPU Usage is Low?
Container-level throttling can occur even if the node has idle CPU. If a CPU limit is set too low, the kernel enforces the quota and restricts the container until more CPU time becomes available in the next quota period. Check throttling metrics at the container or Pod level rather than relying on node averages.
How Do I Choose the Right Kubernetes CPU Request?
Base it on observed CPU usage during busy periods, not just quiet averages. Aim for a request that keeps the service stable when colocated with other workloads, then validate with rollouts and load tests. Revisit the value after major code changes or traffic shifts.
What Happens If You Set a CPU Limit Without a Request?
If a container has a CPU limit but no CPU request, Kubernetes generally uses the limit as its request when no admission-time default request has been applied. This can affect scheduling because the container may be treated as needing more CPU than expected. To avoid unintended resource allocations, configure CPU requests explicitly and check the namespace’s default resource policies.