

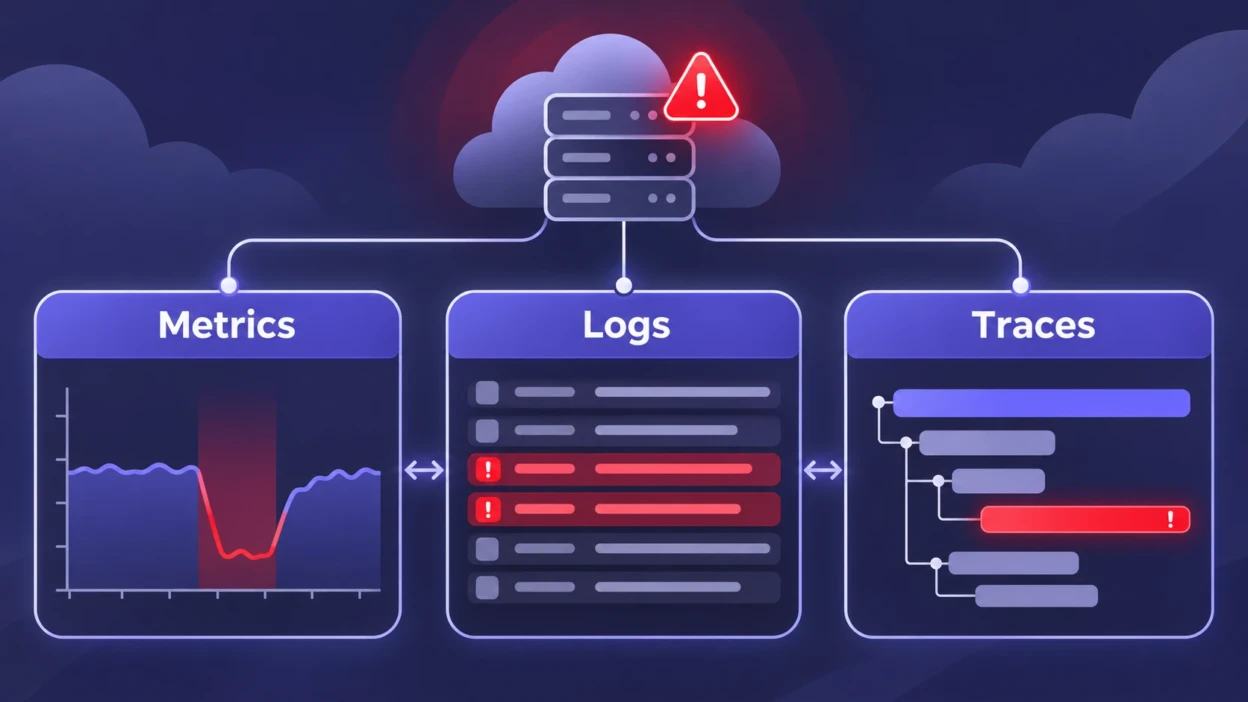
When an application goes down, a dashboard may show rising errors, but it cannot always explain what failed. A log might reveal a permission error, while a trace might show which service encountered it. Each source of information answers a different part of the investigation.
Metrics show how a system is behaving over time. Logs record individual events and errors. Traces follow requests and operations through a system, showing where time was spent or a failure appeared. During an outage, these three types of data work best together rather than competing with one another.
This guide explains what to look for in each signal, how to use them during an incident, and how to avoid common mistakes when diagnosing production failures. For broader background, TechBonafide also explains the difference between observability and monitoring.
Logs vs Metrics vs Traces at a Glance
Logs, metrics, and traces are commonly used observability signals. They describe the same running system from different perspectives, but their data structures and strengths differ.
| Comparison | Metrics | Logs | Traces |
|---|---|---|---|
| What they record | Numerical measurements and aggregations | Individual events with timestamps and context | Related operations, timing, and request paths |
| Main question | How widespread or severe is the problem? | What error or event occurred? | Where did a request slow down or fail? |
| Typical examples | Request rate, error rate, latency, queue depth | Exceptions, access failures, configuration events | API calls, worker operations, database spans |
| Most useful for | Alerting, impact assessment, recovery checks | Event-level diagnosis and supporting evidence | Dependency analysis and request-level investigation |
| Main limitation | Aggregation can hide individual failures | Large volumes and missing context can slow searches | Missing instrumentation or sampling can leave gaps |
A useful mental model is to treat metrics as the view of overall service health, traces as the view of individual execution paths, and logs as evidence from particular operations. These are helpful starting points, not rigid boundaries. Some systems derive metrics from logs or generate metrics from traces.
What Metrics Tell You During an Outage?
Metrics represent numerical measurements collected from an application or its infrastructure. They are especially useful for finding the beginning of an incident, estimating its impact, and checking whether a service has recovered.
Google’s site reliability engineering guidance identifies four golden signals that are useful for user-facing systems:
- Latency: How long requests take, including how failed requests behave.
- Traffic: How much demand the service receives, such as requests per second.
- Errors: How frequently requests or operations fail.
- Saturation: How close a resource is to its effective capacity, such as an overloaded worker pool or queue.
Suppose an image-processing service begins returning errors. A metric dashboard might show a rising failure rate, an increasing queue depth, and a drop in successful processing. These changes help the response team identify the affected service and decide whether users are experiencing a serious problem.
Metrics also help compare conditions before and after a release or infrastructure change. For response times, examining a percentile such as the 95th percentile can reveal slow requests that a simple average may hide. The meaning of a percentile depends on the measurement window, available data, and aggregation method.
However, a high CPU reading does not prove CPU usage caused the outage. A correlation between a deployment and an error spike is also not proof of causation. Metrics identify symptoms and patterns that need further investigation.
The OpenTelemetry metrics documentation explains how counters, gauges, histograms, and their attributes represent different types of measurements.
What Logs Tell You During an Outage?
Logs record events produced by applications, operating systems, infrastructure components, and other services. They are useful when an engineer needs more detail about a failure than a metric can provide.
An application log might report that a storage request was denied, a database connection timed out, or a background task could not read a file. Depending on the logging setup, it may also contain the service name, error type, severity, environment, software version, and request identifier.
Structured logs are especially useful during an incident because fields can be filtered consistently. Instead of searching thousands of unrelated messages, an engineer can focus on errors from one service, one deployment, or one request.
For example, a record containing service=thumbnail-worker, event=object-read-failed, and status=403 would direct attention to a failed storage operation. These are illustrative field values, not records captured from a real service.
Logs still have limitations. An error message can describe what failed without proving why it failed. A permission error, for example, might be related to credentials, access policy, resource identity, or another configuration issue. Missing logs, inconsistent timestamps, and messages without correlation identifiers can make investigation harder.
OpenTelemetry’s logging documentation describes structured event records and ways to associate logs with other telemetry.
What Traces Tell You During an Outage?
A trace represents the execution of a request or operation. It is built from spans, which represent individual units of work. A span can describe an incoming HTTP request, an application function, a database call, or another instrumented operation.
Spans contain timing and contextual information and can have parent-child relationships. Together, they help engineers understand which components participated in an operation and where delays or recorded errors appeared.
Consider a request passing through an API gateway, an application service, and a database. The trace might reveal that most of the request’s duration was spent waiting for a database operation. That is a useful lead, although it does not automatically establish whether the underlying problem was a slow query, lock contention, network delay, or resource exhaustion.
Distributed tracing becomes particularly valuable when an application depends on multiple services. TechBonafide’s API gateway vs load balancer comparison provides additional context on components that may appear along a cloud application’s request path.
Traces depend on suitable instrumentation and context propagation. If a service fails to pass tracing context to another component, the investigation may show separate or incomplete traces. Asynchronous processing can also require explicit context handling or span links.
Tracing systems may sample requests to reduce collection and storage overhead. This means a particular failed request may not be available in the trace backend. The OpenTelemetry sampling guide explains the differences between making sampling decisions early and selecting traces after considering more of their recorded activity.
Example: Investigating a Failed Upload
Consider a hypothetical document-sharing application. Users can upload images successfully, but the application stops generating preview thumbnails. The upload endpoint may still respond normally, while a background worker is failing after the original file has been stored.
This is an illustrative scenario, not a report of a real outage or an independently conducted test.

What Each Signal Reveals?
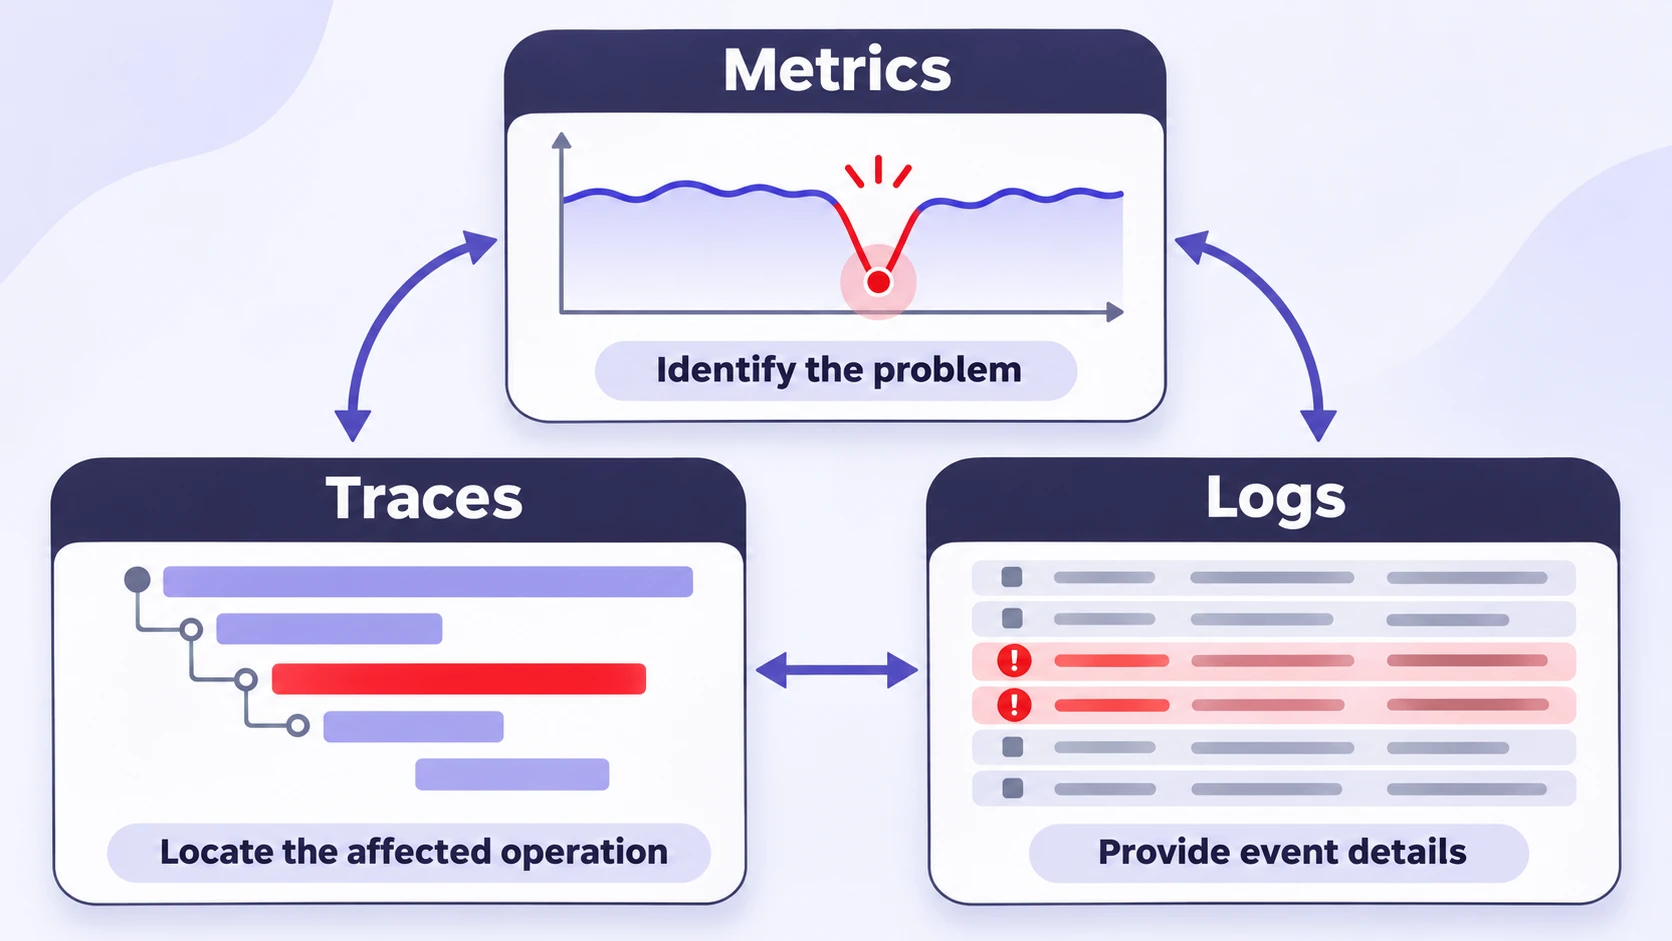
- Metrics identify the impact. The rate of successful thumbnail jobs falls while the processing queue grows. An alert tells the team that preview generation is failing even though initial uploads are still being accepted.
- Traces narrow the investigation. Available traces show the upload service handing work to a queue. Instrumented worker operations reveal failures or delays around object-storage reads. If tracing context is not carried through the queue, engineers may need job identifiers and separate worker traces to follow the operation.
- Logs provide the event details. The thumbnail worker records storage access failures. Deployment and configuration logs show that an access-policy change occurred near the beginning of the problem.
At this point, a recent access-policy change is a plausible explanation, but the timeline alone does not confirm it.
How to Confirm the Suspected Cause?
The response team should inspect the applicable storage policy, worker identity, and affected resource. It should compare failing requests with successful ones and verify whether the worker has the permissions required for the operation.
If the evidence supports a configuration problem, an authorized engineer can apply a reviewed correction or follow an established rollback procedure. The team should then check whether new preview jobs complete successfully, the backlog decreases, and user-facing errors return to normal.
When possible, preserve relevant evidence before making changes. Recovery is supported by successful checks and improving service measurements, not simply by the disappearance of one error message.
A Practical Outage Investigation Workflow
There is no single order that works for every incident. An availability alert may lead directly to logs, while a latency alert may make traces the most useful next step. The following sequence is a reliable starting point when several signals are available.
- Establish the user impact. Check availability, error rates, request latency, and affected workflows. Confirm whether the problem is active and how broadly it affects users.
- Define the incident window. Compare healthy and unhealthy periods. Review relevant deployments, configuration changes, dependency events, and infrastructure alerts.
- Find the failing path. Use available traces to identify affected services, slow operations, and failing dependencies. If traces are unavailable, use route, service, or job identifiers to narrow the search.
- Read the relevant event evidence. Filter logs by service, time, error type, release version, and correlation identifier where available. Check whether repeated messages describe a shared failure.
- Test the explanation. Compare the suspected cause against independent evidence. Avoid changing multiple unrelated settings at once, and use an approved incident-response process for potentially disruptive fixes.
- Verify and document recovery. Confirm that representative user operations work, important metrics recover, and the relevant failures no longer appear. Record the timeline, evidence, and remaining uncertainty.
For example, a latency spike may be caused by a downstream dependency rather than by the service reporting the slow request. The investigation should follow the evidence across service boundaries before assigning responsibility.
During a major incident, restoring service and coordinating communication may take priority over identifying every contributing factor immediately. Detailed root-cause analysis can continue after the immediate impact is controlled.
Common Observability Blind Spots
Collecting more data does not automatically produce better answers. Poor instrumentation, noisy signals, and missing context can undermine an investigation.
- Metrics hide individual cases: Aggregated measurements may look acceptable even when a small group of requests is failing. Check relevant routes, regions, or customer-impact indicators where appropriate.
- Logs lack context: A timestamp and error message may not identify the request or deployment involved. Consistent service metadata and correlation identifiers help narrow searches.
- Traces have gaps: Sampling or missing instrumentation can make a failed operation invisible. An absent trace is not proof that the operation succeeded.
- Metric labels become too detailed: Recording unbounded values such as individual request IDs as metric labels creates excessive cardinality and can increase resource usage. Keep such identifiers in suitable log or trace fields instead.
- Telemetry arrives late or stops: Delayed collection, an overloaded backend, or a failed exporter can distort the incident timeline. Compare collection health and independent service checks before drawing conclusions.
Important: Increasing debug logging or capturing complete requests during an outage can expose passwords, access tokens, personal information, and other secrets. Use approved access controls and redaction rules, avoid collecting sensitive fields unnecessarily, and review logging changes before applying them to production.
The OWASP Logging Cheat Sheet explains which sensitive information should generally be excluded or protected. Observability needs to support investigation without creating a separate security problem.
How to Prepare Before an Outage?
Good incident investigation begins before anything breaks. Teams do not need to collect every possible event or adopt every available monitoring product. They need enough reliable information to answer common operational questions.
- Choose user-centered metrics. Monitor successful and failed requests, meaningful latency measurements, traffic, and resource saturation. Add queue or job-completion metrics for background workflows.
- Standardize log fields. Use consistent service names, timestamps, severity levels, environment labels, and relevant request or job identifiers.
- Instrument important request paths. Capture spans for key operations and propagate context across service boundaries. For queues and asynchronous jobs, define an appropriate correlation strategy.
- Connect signals where possible. Trace and span identifiers can link related logs to a request. Consistent resource attributes and timestamps make cross-signal investigation easier.
- Control collection costs and risks. Review retention periods, access permissions, metric cardinality, trace sampling, sensitive-data handling, and the health of telemetry pipelines.
- Practice recovery checks. In an approved test environment, simulate a recoverable failure and confirm that alerts, logs, traces, and operational procedures provide useful evidence.
OpenTelemetry’s context propagation documentation explains how trace identifiers can connect operations across components and support correlation with log records.
For teams building these practices from the ground up, TechBonafide’s beginner DevOps learning path includes monitoring and incident readiness as part of operating an application.
Which Signal Should You Check First?
Start with the question you need to answer, not with a preferred tool.
- Is the service down or getting slower? Start with metrics and independent health checks.
- Which dependency is delaying requests? Look for representative traces.
- What exception or access failure occurred? Check relevant logs.
- Is the incident limited to one deployment or region? Compare appropriately labeled metrics, traces, and logs.
- Did a repair work? Verify user-facing behavior and recovery metrics, then check supporting traces or logs.
A small application may be adequately served by health checks, meaningful metrics, and structured logs with request IDs. A distributed application with multiple services and asynchronous jobs is more likely to benefit from end-to-end tracing. The best combination depends on the architecture, failure modes, operational requirements, and data collection budget.
None of these signals guarantees a root cause by itself. The aim is to form an explanation that fits the available evidence and then verify it.
Conclusion
Logs, metrics, and traces answer different questions during an outage. Metrics reveal when service behavior changes and how much of the system is affected. Traces show where instrumented requests and operations spend time or encounter failures. Logs add the individual events and technical context needed to investigate those failures.
The strongest approach is to connect all three while recognizing their limitations. Start by measuring user impact, follow the affected operation, examine relevant event evidence, and confirm recovery through independent checks. That process is more reliable than choosing a cause from a single graph or error message.

Tech Bonafide is the editorial identity of TechBonafide, an independent technology publication covering AI, software, cybersecurity, gadgets, and emerging technology.